Derek Bonilla
Learning by doing.
COVID-19 Data Exploration Using SQL
About the Our World in Data COVID-19 dataset
| Timespan | January 28, 2020 - June 25, 2021 |
| Dataset | Our World in Data COVID-19 |
| Link | https://ourworldindata.org/covid-deaths |
The variables represent all of the main data related to confirmed cases, deaths, hospitalizations, and testing, as well as other variables of potential interest.
The columns in this dataset are:
iso_code, continent, location, date, total_cases, new_cases, new_cases_smoothed, total_deaths, new_deaths, new_deaths_smoothed, total_cases_per_million, new_cases_per_million, new_cases_smoothed_per_million, total_deaths_per_million, new_deaths_per_million, new_deaths_smoothed_per_million, reproduction_rate, icu_patients, icu_patients_per_million, hosp_patients, hosp_patients_per_million, weekly_icu_admissions, weekly_icu_admissions_per_million, weekly_hosp_admissions, weekly_hosp_admissions_per_million, total_tests, new_tests, total_tests_per_thousand, new_tests_per_thousand, new_tests_smoothed, new_tests_smoothed_per_thousand, positive_rate, tests_per_case, tests_units, total_vaccinations, people_vaccinated, people_fully_vaccinated, new_vaccinations, new_vaccinations_smoothed, total_vaccinations_per_hundred, people_vaccinated_per_hundred, people_fully_vaccinated_per_hundred, new_vaccinations_smoothed_per_million, stringency_index, population, population_density, median_age, aged_65_older, aged_70_older, gdp_per_capita, extreme_poverty, cardiovasc_death_rate, diabetes_prevalence, female_smokers, male_smokers, handwashing_facilities, hospital_beds_per_thousand, life_expectancy, human_development_index, excess_mortality
Our World in Data has made a full codebook available, with a description and source for each variable in the dataset.
Getting The Data
Our World in Data has an abundance of data on COVID-19. From deaths, vaccinations, to policy responses and many more. I wanted to explore the data on confirmed COVID-19 deaths for all countries.
The original file that I downloaded from Our World in Data is here. However, for training purposes, I formatted the downloaded dataset into two different CSV files coviddeaths.csv and covidvaccinations.csv. My intention was to perform fundamental SQL statements at the beginning and later progress into other techniques like JOINS.
Importing The Datasets Into PostgreSQL
As a Mac user my platform of choice is pgAdmin and PostgreSQL. Finding how to import the datasets was another project unto itself.
One of the biggest issues that I ran into was finding the data type of each column in the datasets. I decided on putting the numeric data type on most, text data type for columns like continent and location, and the date data type for the date column. I’ve seen tutorials on how to get the data type of columns using Python, but that is ahead of my skill level for now. In the future I will come back to this project to examine this issue again. I’m open to any advice.
1. Create a Table in pgAdmin
CREATE TABLE coviddeaths
(
iso_code text,
continent text,
location text,
date date,
population numeric,
total_cases numeric,
new_cases numeric
);
2. Import the CSV File
I decided to skip the query writing and let pgAdmin import the file for me. To do this, simply right-click on the table in the tree on the left and select the Import/Export… menu item.
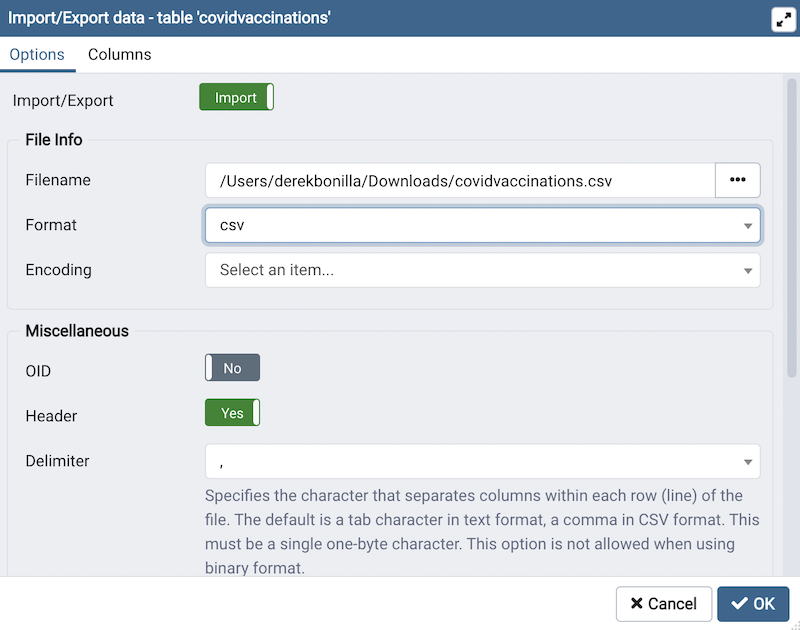
In the new window. I set the slider to Import. Then selected the source file and set the format to csv. Set the Header to Yes because this file has a header. Selected the Delimiter as a comma. The data was imported and my table was ready to be explored.
Time For Exploration
SQL Query Example 1
SELECT location, date, total_cases,total_deaths, (total_deaths/total_cases)*100 AS DeathPercentage
FROM public.coviddeaths
WHERE location LIKE '%States%'
AND continent IS NOT null
ORDER BY 1,2
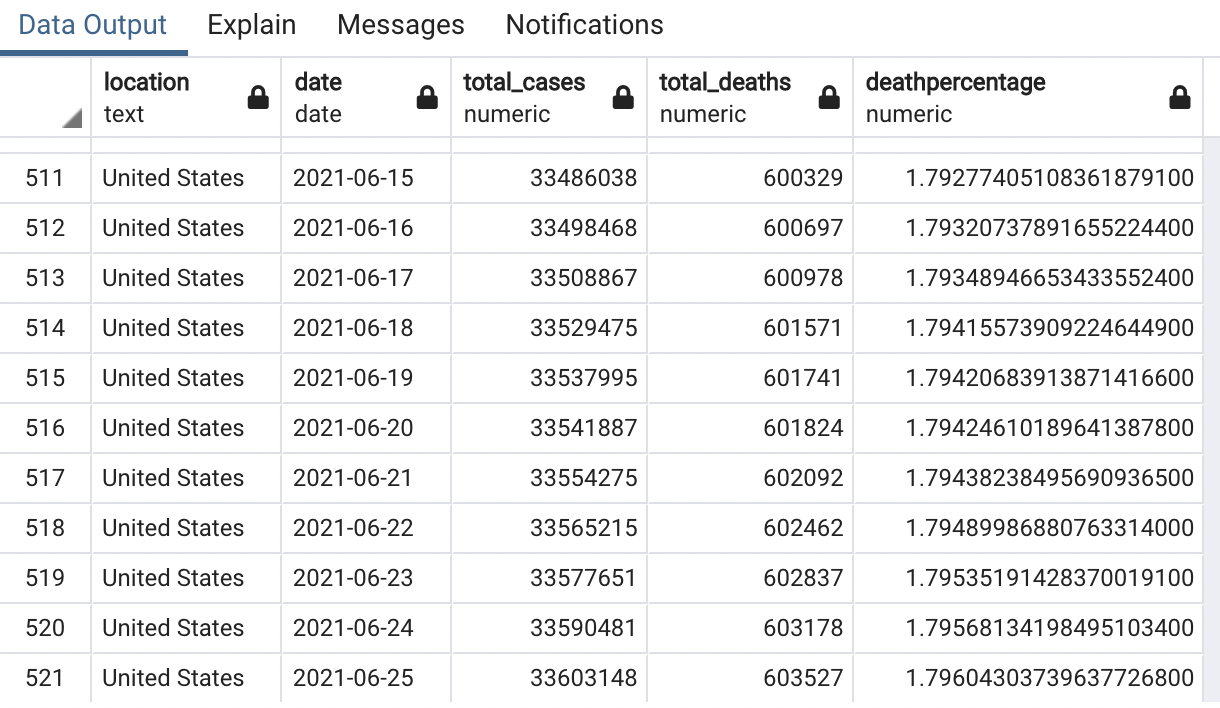
With this SQL query I put up the total_cases against the total_deaths to find the Death Percentage (likelihood of dying if contracted COVID-19). In the United States, as of June 25, 2021, this percentage was 1.79% vs 5.16% at the same time in 2020.
SQL Query Example 2
SELECT SUM(new_cases) AS total_cases, SUM(CAST(new_deaths AS int)) AS total_deaths, SUM(CAST(new_deaths AS int))/SUM(New_Cases)*100 AS DeathPercentage
FROM public.coviddeaths
--WHERE location LIKE '%states%'
WHERE continent IS NOT null
--GROUP BY date
ORDER BY 1,2
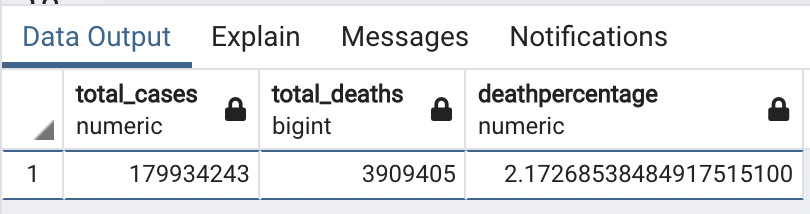
Data shows that globally the current Death Percentage as 2.17%
SQL Query Example 3
SELECT dea.continent, dea.location, dea.date, dea.population, vac.new_vaccinations,
SUM(CAST(vac.new_vaccinations AS int)) OVER (PARTITION BY dea.location ORDER BY dea.location, dea.date)
AS RollingPeopleVaccinated
--, (RollingPeopleVaccinated/population)*100
FROM public.coviddeaths dea
JOIN public.covidvaccinations vac
ON dea.location = vac.location
AND dea.date = vac.date
WHERE dea.continent IS NOT null
ORDER BY 2,3
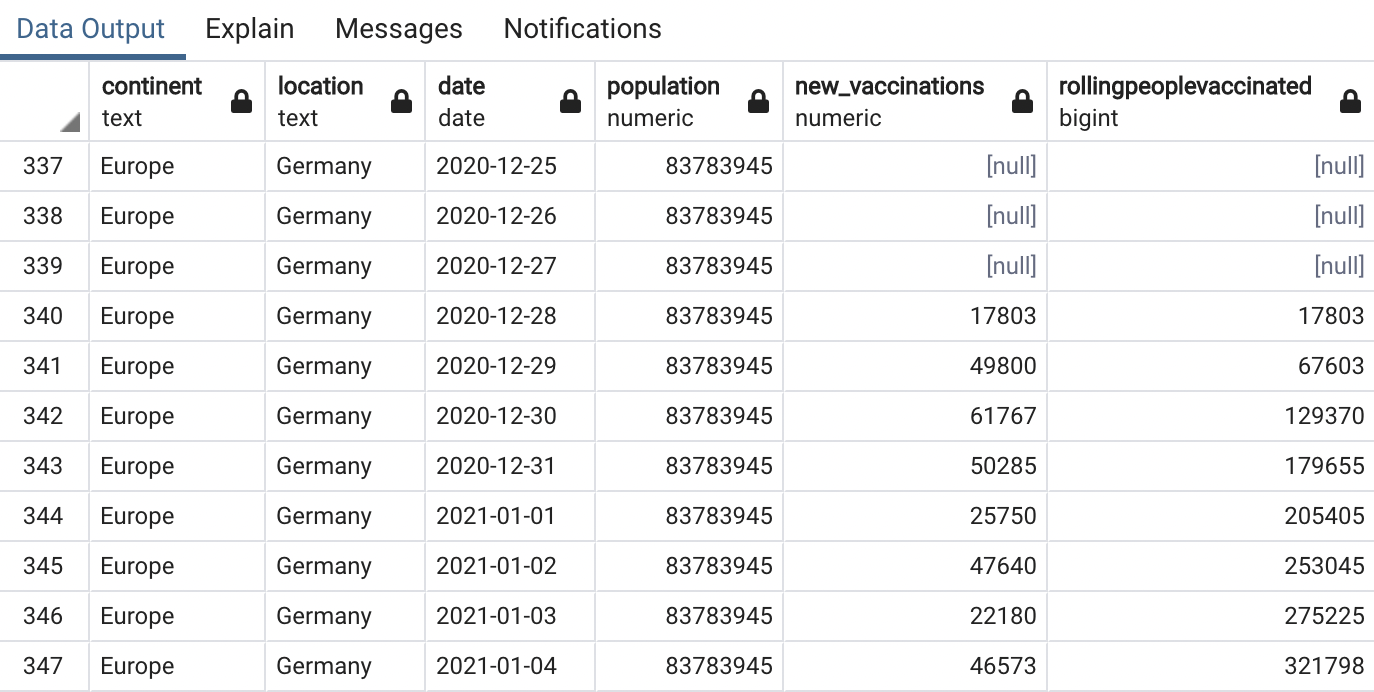
Completed a JOIN to look at the total population vs vaccinations. RollingPeopleVaccinated is a rolling count of people in a country that has been vaccinated.
To view the entire list of queries performed, click on the View on GitHub badge at the top of this page.
Conclusion
There is so much data in the original data set. I would like to go back and focus on specific countries. Also, Our World in Data has many other data sets that look at other topics. One that interests me are the policy responses to COVID-19. There is data on face coverings, school and workplace closures, stay-at-home restrictions, etc. In future projects I will dive into some of them.